Information Center
We are proud of our accomplishments and invite you to check out the impact we’ve made — with your help!

BCPS Snapshot
Major increase in student poverty in Baltimore County Public Schools: 2023
There is a new presentation titled “The Effects of Poverty and Food Insecurity on Education in Baltimore County & the Mission of the Student Support Network“, by Dr. Laurie Taylor-Mitchell, Founder, SSN and Tam Lynne Kelley, LMSW, Advocacy Committee Chair. To view the presentation, click here
The statistics for the 2023-2024 school year for BCPS show that 81,000 students qualify for FARMS (Free/Reduced Price Meals).
The vast majority of these students, more than 80,000, live at 130% of the federal poverty guidelines, which in 2024, for a family of four people, is an annual income limit of no more than $40,560. Read more about Child Nutrition Programs Income Eligibility Guidelines at the USDA Food and Nutrition Service website.
According to the MIT Living Wage Calculator, in Baltimore County the income needed for basic expenses for a family of four people, before taxes, is now $111,953 a year. See the full chart and learn more by visiting the MIT Living Wage Calculator website.
Even though all BCPS students are eligible to receive free school meals in the 2023-2024 school year, student eligibility for free/reduced price meals remains an essential indicator of poverty which guides our work.
Homelessness: As of 12/31/2023, school staff identified 1989 students as experiencing homelessness.
Read the BCPS document on numbers of students identified as homeless by school.
Looking to educate yourself on the issue of Food Insecurity?
Data from the Youth Risk Behavior Survey shows that 30% of all high school students in Baltimore County experienced food insecurity – higher than the state average. With the FARMS rate now up to 74.11% of all BCPS students (an increase from 43.7% of all students in 2018), hunger and food insecurity levels, and the physical and health disparities associated with them as indicated in sections of the report, are higher than ever now.
Every picture is worth a thousand words!
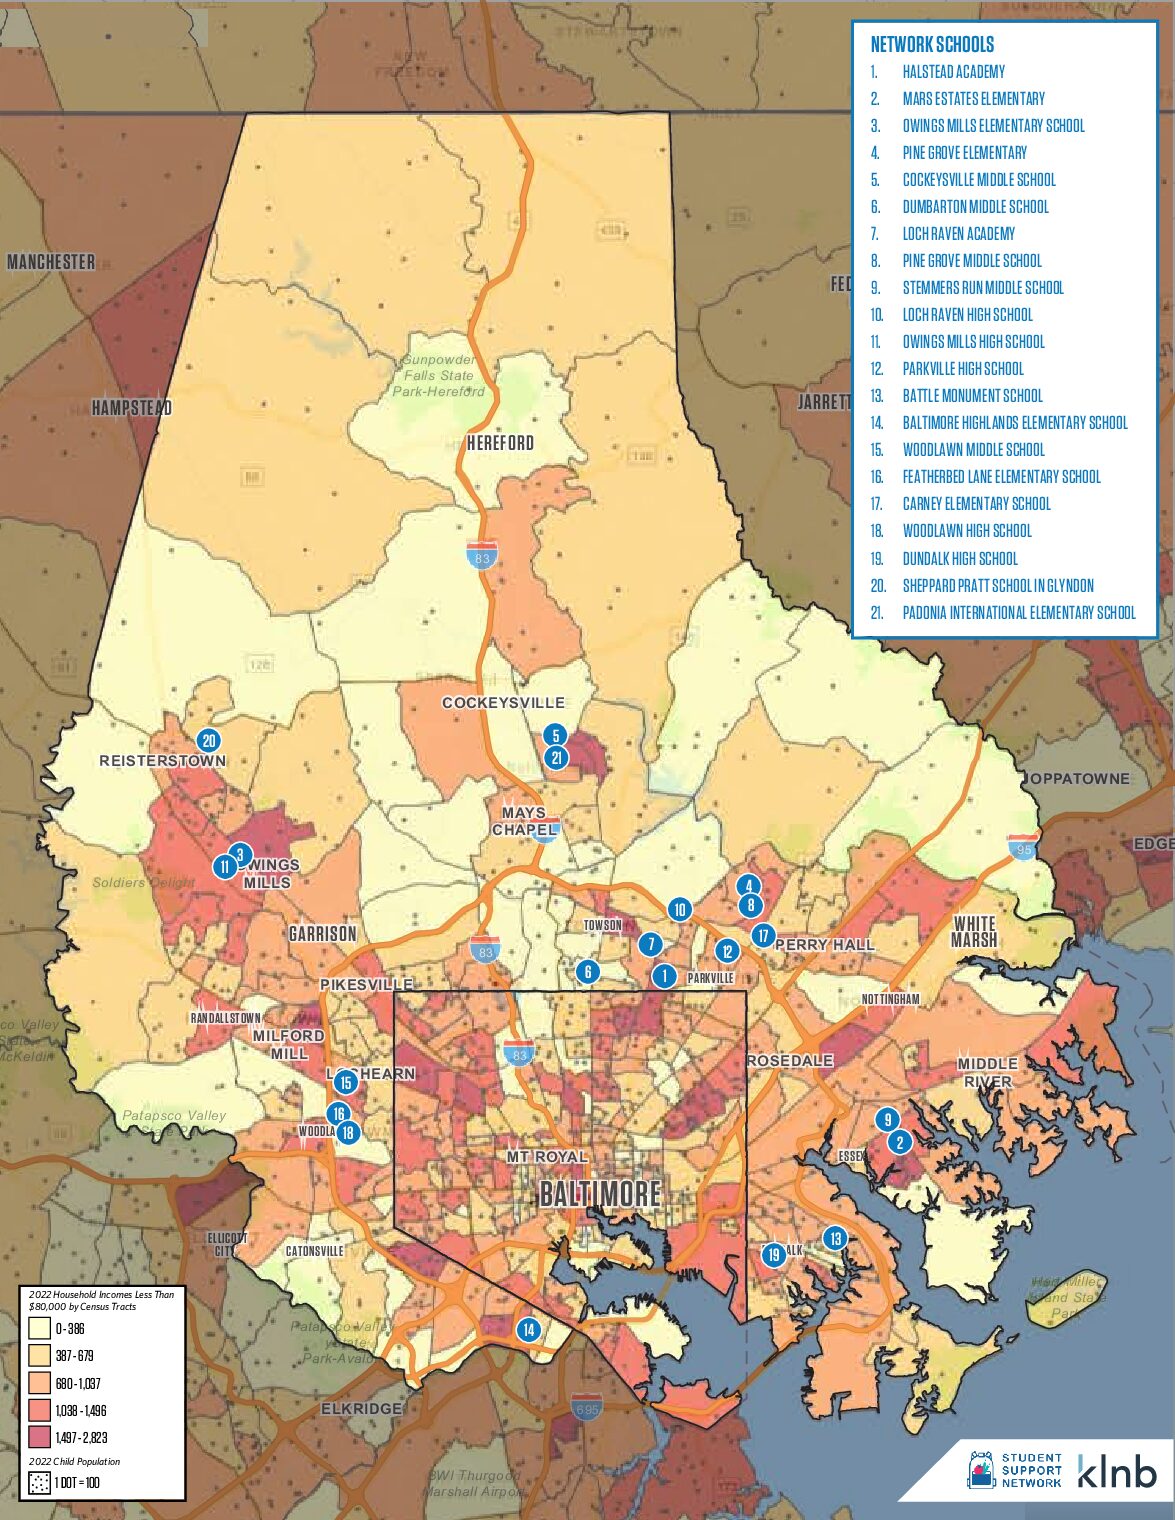
The map at left illustrates Baltimore County poverty rates, the concentration of children living in poverty across the county, and the locations of Network schools. Click on the map to enlarge it.
Student Poverty By Government District 2023-2024
Poverty in Baltimore County is widespread and increasing, and all legislative districts now have concentrations of poverty. To advocate effectively for improving the lives and education of Baltimore County students, it is important to understand where poverty exists in various legislative districts. Schools also may have large catchment areas overlapping multiple districts. These maps show the locations of schools so that advocates may contact elected officials when schools of concern are located within their districts. The heat map “plots” are based on concentrations of low-income families qualifying for SNAP, the Supplemental Nutrition Assistance Program, and for free meals in school. For example, to be eligible for SNAP under the federal guidelines, the annual income for a family of four cannot exceed $40,560. According to the MIT Living Wage Calculator, the income needed for basic expenses for a family of four (2 working adults, 2 children) in Baltimore County is $111,953. These Students and their families live in extreme poverty. The maps are divided by councilmanic, state, and congressional districts, and by elementary, middle, and high schools.
-
- Go to https://vote.baltimorecountymd.gov/Address.aspx?pageid=2
- Enter your address (a prompt will usually appear below so you may not have to type it all in)
- Hit “Submit”
- Your Councilmanic, State, and Congressional Districts, Election District, and Election Precinct, will appear below
Credit for the research and creation of the following “heat maps” goes to Fergal Mullaly, a Student Support Network volunteer.
Follow this link and click councilmanic maps for a full-size view.
For all other maps, click on the links as indicate..
Councilmanic Districts
Legislative Districts
Congressional Districts
Dramatic Increases in Levels of Need
Poverty levels have been rising for many years in Baltimore County. For example, in 2006, 14% of all students at Loch Raven High School qualified for FARMS. Now, 80% of all students at this school qualify for FARMS.
There are only 15 public schools left in Baltimore County (169 schools offering meal service) where the percentage of students eligible for FARMS is less than 30%.
In academic year 2023-24, all schools within the Network experienced increases in the percentages of students qualifying for Free/Reduced Price Meals. The current (as of Spring, 2024) statistics on FARMS eligibility within Network schools are shown below.
Note: the percentage of 100% indicates the school currently offers free breakfast and lunch to all students, implementing the Community Eligibility Provision.
| SCHOOL | % Students Eligible for FARMS | # Students Eligible for FARMS |
| Baltimore Highlands Elementary | 100% | 495 |
| Featherbed Lane Elementary | 100% | 539 |
| Halstead Academy | 100% | 472 |
| Mars Estates Elementary | 100% | 350 |
| Stemmers Run Middle | 100% | 812 |
| Woodlawn Middle | 100% | 563 |
| Carney Elementary | 100% | 513 |
| Woodlawn High | 96% | 1817 |
| Dundalk High | 92% | 1993 |
| Owings Mills Elementary | 91% | 659 |
| Loch Raven Technical Academy | 90% | 707 |
| Battle Monument School | 87% | 52 |
| Owings Mills High | 86% | 1004 |
| Padonia International Elementary | 84% | 476 |
| Parkville High | 82% | 1,667 |
| Loch Raven High | 80% | 683 |
| Pine Grove Middle | 74% | 633 |
| Pine Grove Elementary | 62% | 294 |
| Cockeysville Middle | 56% | 492 |
| Dumbarton Middle | 38% | 411 |
| Sheppard Pratt Schools | 36% | 50 |

